A packing line loses a drive bearing at 7,000 operating hours, although the catalog lists an L10 life of 15,000 hours. The maintenance team inspects the failed unit and finds spalling on the raceway, darkened grease, and a slightly worn housing bore. This pattern is familiar to anyone who manages rotating equipment. Bearing life is a statistical prediction, not a fixed guarantee. It assumes clean lubrication, correct mounting, and limited contamination. When the real application drifts from those assumptions, actual life can fall far below the catalog value. Knowing what bearing life means, how it is calculated, and which factors shorten it helps engineers and maintenance teams make better decisions from design through operation.
What Does Bearing Life Actually Mean?
Bearing life is the total number of revolutions, or operating hours at a given constant speed, that a bearing can complete before fatigue develops on the raceways or rolling elements. The bearing industry expresses this as a statistical rating instead of a fixed lifetime. The most widely used rating is L10, sometimes called basic rating life. L10 states that 90 percent of a group of identical bearings will complete or exceed that life before fatigue failure occurs. In other words, no one can tell exactly when a specific bearing will fail, but the L10 value gives a reliable planning baseline for a population of machines.
The L50 median life is about five times the L10 value. Half of the bearings in a group can be expected to reach or exceed L50. Many bearings run well past L50 when lubrication and sealing are well maintained. Designers use L10 for conservative sizing, while reliability engineers treat it as one input in a broader risk assessment.
How Is Bearing Life Calculated?
The basic rating life calculation depends on two quantities: the basic dynamic load rating C and the equivalent dynamic bearing load P. For ball bearings, the basic rating life in million revolutions is L10 = (C/P)^3. For roller bearings, the exponent is 10/3 instead of 3, reflecting the different stress distribution of line contact. When speed is constant, the life in hours becomes L10H = [10^6 / (60 x n)] x (C/P)^p, where n is the rotational speed in revolutions per minute and p is the life exponent.
Because real operating conditions differ from laboratory test conditions, ISO 281 also defines the modified rating life Lnm. This is calculated by multiplying the basic rating life by adjustment factors for reliability, material and manufacturing quality, and operating conditions such as lubrication and contamination. These factors matter enormously in practice. A bearing running with contaminated grease may have a modified life that is only one-tenth of the basic L10 value.
ISO 281 reliability adjustment factors reduce the basic rating life as the required survival probability increases.
Reliability
Rating life symbol
Adjustment factor a1
90%
L10
1.00
95%
L5
0.62
96%
L4
0.53
97%
L3
0.44
98%
L2
0.33
99%
L1
0.21
The table shows a steep decline in the adjustment factor as reliability grows. A 90 percent reliability target keeps the full L10 life, while a 99 percent target retains only 21 percent of it. This is why bearing selection always involves a tradeoff between calculated life and confidence level. For critical equipment, designers accept a shorter calculated life to gain higher survival confidence. For general machinery, L10 provides a balanced baseline for cost and performance. These a1 values follow the ISO 281 standard and are used by bearing manufacturers worldwide.
What Happens as Reliability Requirements Rise?
The L10 life assumes 90 percent reliability, but many critical machines require higher confidence. The relationship between reliability and bearing life is nonlinear, and the line chart below shows how expected life drops as the reliability target rises. The chart assumes a bearing with an L10 rating of 10,000 hours.
The curve bends downward steeply as reliability moves beyond 90 percent. At 90 percent reliability, the bearing reaches roughly 10,000 hours. When the target reliability is raised to 95 percent, the expected life falls to approximately 6,200 hours. At 99 percent reliability, the estimated life is only about 2,100 hours, roughly one-fifth of the L10 value. This non-linear relationship explains why ISO 281 uses life adjustment factors rather than simple linear derating. It also reveals why machine designers do not always design for the highest reliability level. A balanced approach links the reliability target to the actual consequence of failure in that specific machine.
Why Real Bearings Fail Early: The Main Culprits
Field studies consistently show that load and speed alone rarely explain premature bearing failure. The horizontal bar chart below ranks the most common contributors. Each bar represents the approximate percentage of premature failures where that factor played a role.
The chart ranks the most common contributors to premature bearing failure. Contamination leads with an 80 percent share, meaning foreign particles enter the bearing and cause indentation and wear. Inadequate lubrication follows at 70 percent, because a broken lubricant film allows metal-to-metal contact and rising friction. Misalignment during mounting contributes 55 percent and creates uneven load distribution across the raceways. Overload accounts for 45 percent, including both continuous overload and shock loads that exceed the dynamic capacity. Thermal stress causes 35 percent of failures, usually as a secondary effect of poor lubrication or blocked heat paths. These causes rarely act alone, which is why effective maintenance programs address sealing, lubricant selection, and mounting procedures as a package.
Load and Life: A Nonlinear Relationship
Few engineering relationships are as unforgiving as the load-life curve of a ball bearing. Because the life formula uses an exponent of 3, a small change in applied load produces a large change in expected life. The column chart below shows relative fatigue life at different load levels, normalized to the rated dynamic load.
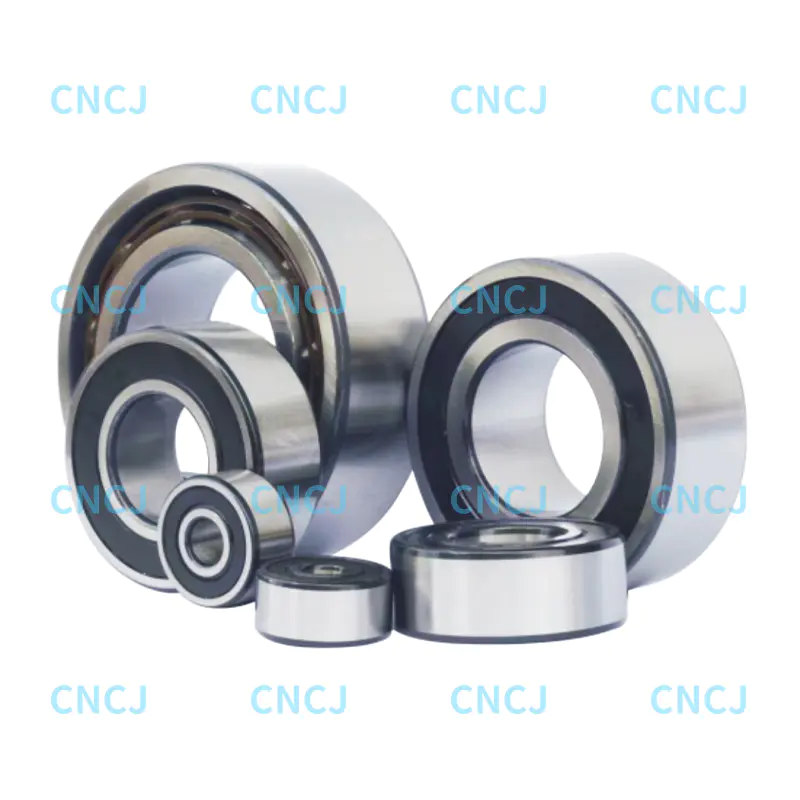
The chart shows relative fatigue life at various operating loads compared with the catalog rated load. When the bearing runs at 50 percent of the rated dynamic load, it achieves approximately eight times the catalog L10 life. At 75 percent load, life equals roughly 2.4 times the catalog rating. The 100 percent column represents the baseline L10 life used in product catalogs. Once the operating load reaches 125 percent, expected life falls to about 40 percent of the catalog value. At 150 percent load, the remaining life is only one-fifth of the catalog expectation. This extreme sensitivity comes from the cubic exponent in the life equation for ball bearings, so selecting a bearing with a higher dynamic load rating is often the most effective way to protect service life. For applications where loads fluctuate or peak unexpectedly, the 32/33 series double-row angular contact ball bearings provide an attractive combination of higher load capacity and compact mounting dimensions.
The internal geometry of a bearing determines how well it handles load direction, speed, and misalignment, and that directly affects the life operators can expect. In many industrial machines, the comparison comes down to double-row angular contact ball bearings versus deep groove ball bearings. The radar chart below rates the two designs for five performance traits on a scale from 1 to 5.
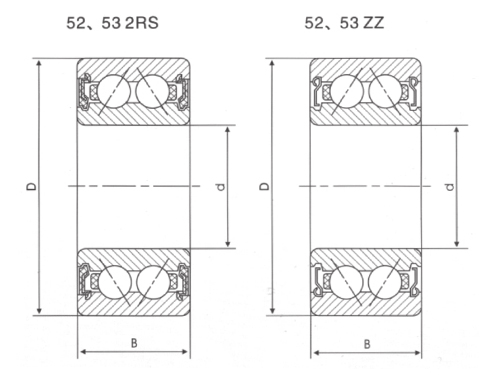
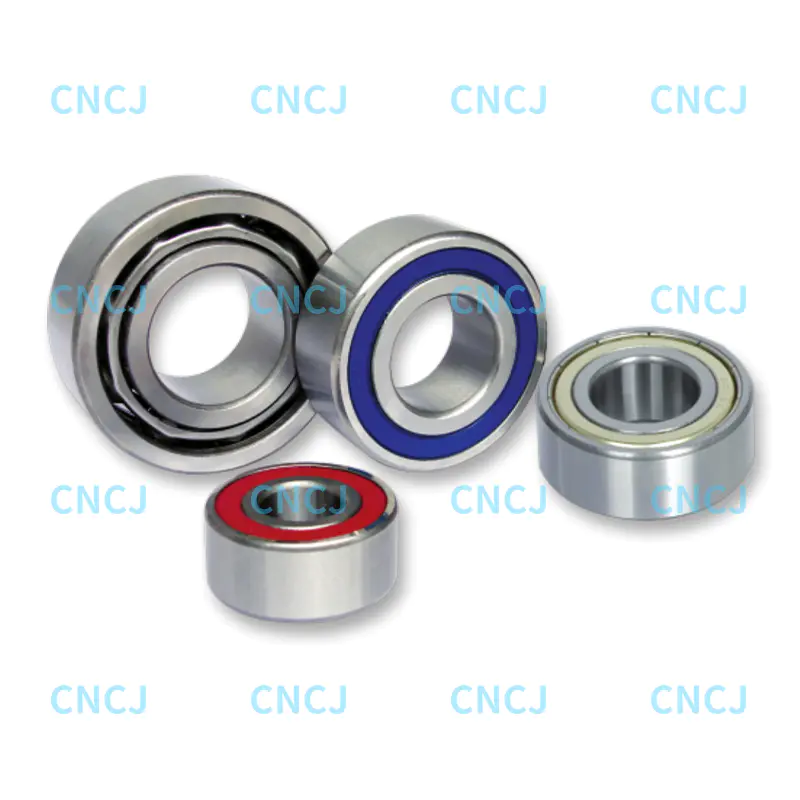
The radar chart compares double-row angular contact ball bearings with deep groove ball bearings across five performance traits. Double-row angular contact designs score highest in radial and axial load capacity because their angled contact surfaces support combined loads. Deep groove ball bearings show a clear weakness in axial load capacity, scoring only 2 out of 5. In high-speed operation, deep groove ball bearings have the advantage, scoring 4 versus 3 for double-row designs. Both types score similarly on noise behavior and compactness, with slight differences depending on size. For applications that carry heavy radial and axial loads simultaneously, the double-row angular contact design delivers measurably longer bearing life. The 52/53 series double-row angular contact ball bearings are a common example of this construction, and they excel in gearboxes, electric motors, and robot joints where directional load changes are frequent.
For positions dominated by radial load with only moderate axial load and high rotational speed, deep groove ball bearings remain an efficient and cost-effective choice. They are also the default solution for many small electric motors, pumps, and general transmission applications. The key insight is that matching the bearing type to the actual load spectrum does more for bearing life than upgrading steel grade or reducing tolerance class alone.
Manufacturing precision matters, but most bearing life is determined by what happens after the bearing leaves the factory. The following measures give the largest reliability gains in real-world operation.
Mounting and Installation
Proper mounting is the first opportunity to protect bearing life. Pressing the inner ring with direct force, checking shaft and housing tolerances, and avoiding hammer blows prevent premature raceway damage. The proper installation and maintenance of angular contact bearings directly improves system reliability, especially for double-row designs where the contact angle must remain unchanged.
Lubrication and Sealing
Lubrication is the second critical lever. Grease type, re-lubrication interval, and fill volume should follow the manufacturer recommendations rather than a one-size-fits-all schedule. Sealing is equally important. A sealed bearing with a well-designed housing keeps contamination out and retains the lubricant, often multiplying service life several times over. In dirty environments, shielded or sealed variants reduce the contamination risk shown in the failure factor chart above.
Preload and Clearance
Preload and internal clearance also influence bearing life. Excessive preload raises operating temperature and reduces fatigue life, while insufficient preload allows skidding in the loaded zone. The long-term operation of double-row angular contact ball bearings depends on setting the correct preload and maintaining it through proper tightening and shaft fit. The 52/53 and 32/33 series both offer predictable preload behavior when installed with the recommended bearing seat tolerances.
Condition Monitoring
Finally, monitoring matters. Vibration analysis, temperature checks, and lubricant analysis can detect the early stage of fatigue before it becomes a catastrophic failure. Trending these indicators over time gives maintenance teams the confidence to plan replacement during scheduled downtime instead of reacting to an unplanned stoppage. For high-value production equipment, condition monitoring is not optional; it is the only way to know where a bearing sits on its life curve.
Bearing life is a calculated prediction, a maintenance planning tool, and a design input all at once. It is not a mystery that determines whether a machine will fail, but a measurable property of the bearing, its loading, and its operating environment. By understanding the L10 rating, using ISO 281 adjustment factors, and attacking the real-world causes of early failure, engineering teams can close the gap between catalog predictions and field experience. That gap is precisely where reliability gains are found.
 English
 中文简体
中文简体 Deutsch
 Español